Reducing preventable dispensing delays.
Giving pharmacists the context to assess interval time orders without manual investigation.
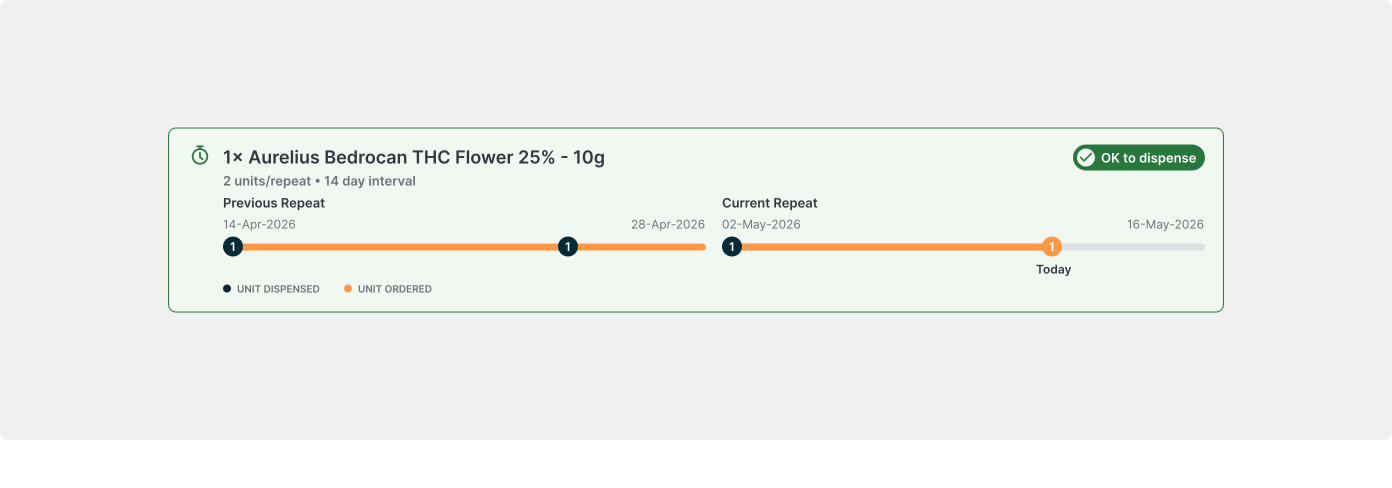
Paid for. But unable to dispense.
Patients were ordering medication through uMeds, only to discover that the pharmacy could not dispense it. These orders were marked Unable to Dispense (UTD) and referred to Pharmacy Operations for investigation.
What began with a pharmacy visit in July 2024 became a two-year effort to understand the problem, advocate for prioritisation, and address its underlying causes. The solution combined an order allocation fix with a pharmacist-facing interval time visualiser.
Following the visualiser’s launch, weekly Interval Time UTDs fell from 97 to 52, with the improvement sustained over the next 13 weeks.
01 / THE PROBLEM
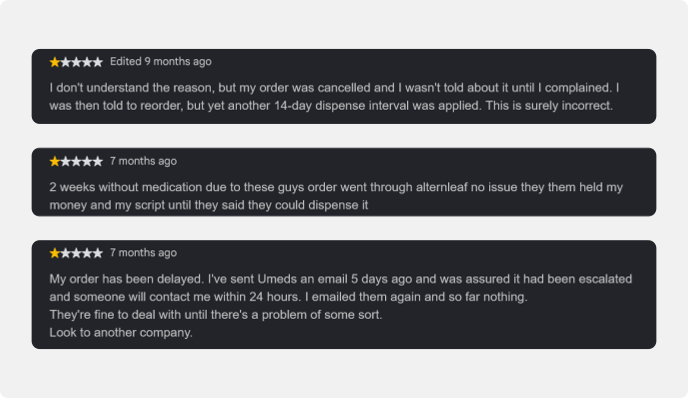
A successful checkout did not guarantee a dispensable order.
During a pharmacy visit in 2024, I observed pharmacies receiving orders they could not dispense. Each UTD created work across multiple teams. Pharmacy Operations investigated operational issues, Nurses resolved clinical issues, and Customer Support and CRM communicated the delay to patients. Cancellations also required Finance to process refunds.
As the backlog grew, patients could wait days for an update. Dispense Limit and Interval Time were the two largest recorded UTD categories. I repeatedly advocated for these issues to be prioritised.
What is interval time?
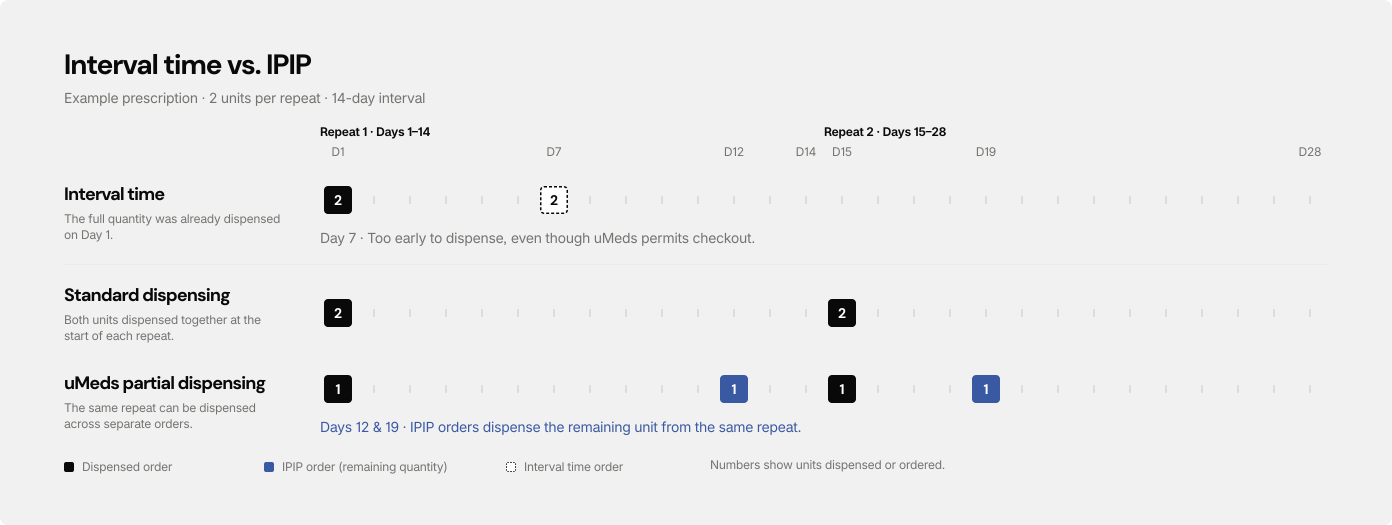
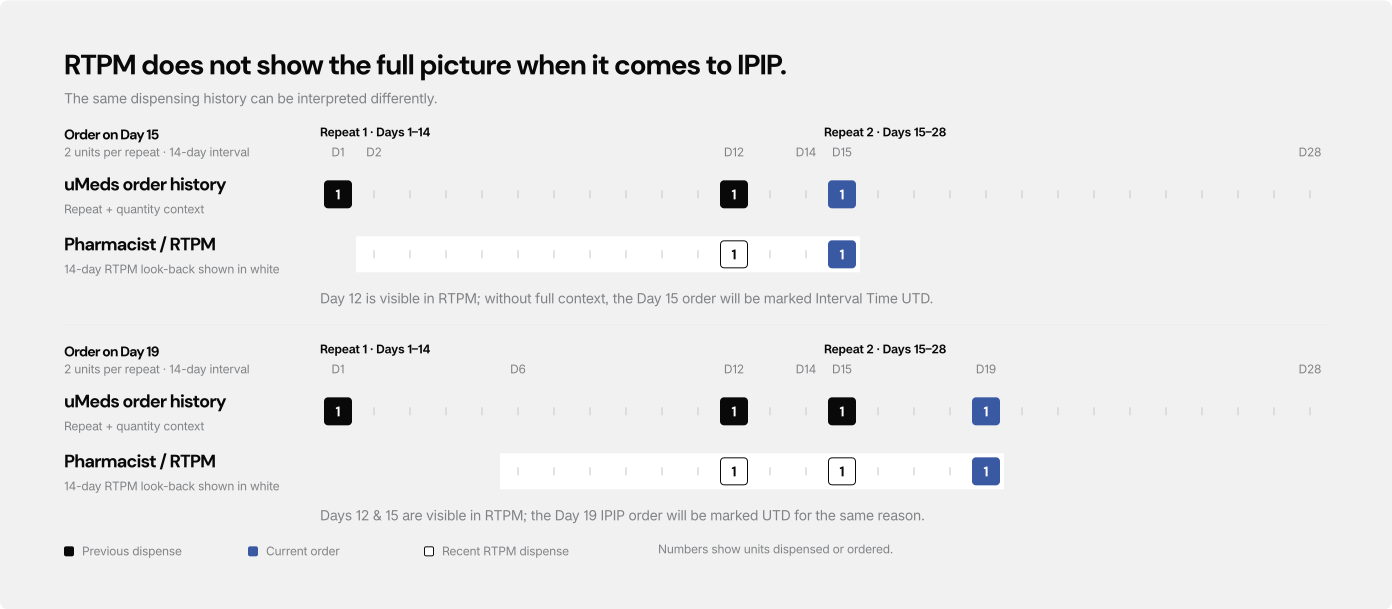
Interval time specifies how frequently a prescription repeat can be supplied. Consider a simplified prescription allowing two units per repeat, with a 14-day interval. Ordering the next repeat before the interval has elapsed can result in a dispensing restriction.
However, uMeds also supports partial quantities within a repeat: a patient might purchase one unit on Day 1 and the remaining unit on Day 7. Medicinal cannabis can cost around $100 per unit and is not subsidised through the PBS, making this flexibility important.
Internally, the second purchase is called an Interval Period in Progress (IPIP) order. Distinguishing an IPIP order from a genuine interval time order became central to the investigation.
03 / DISCOVERY
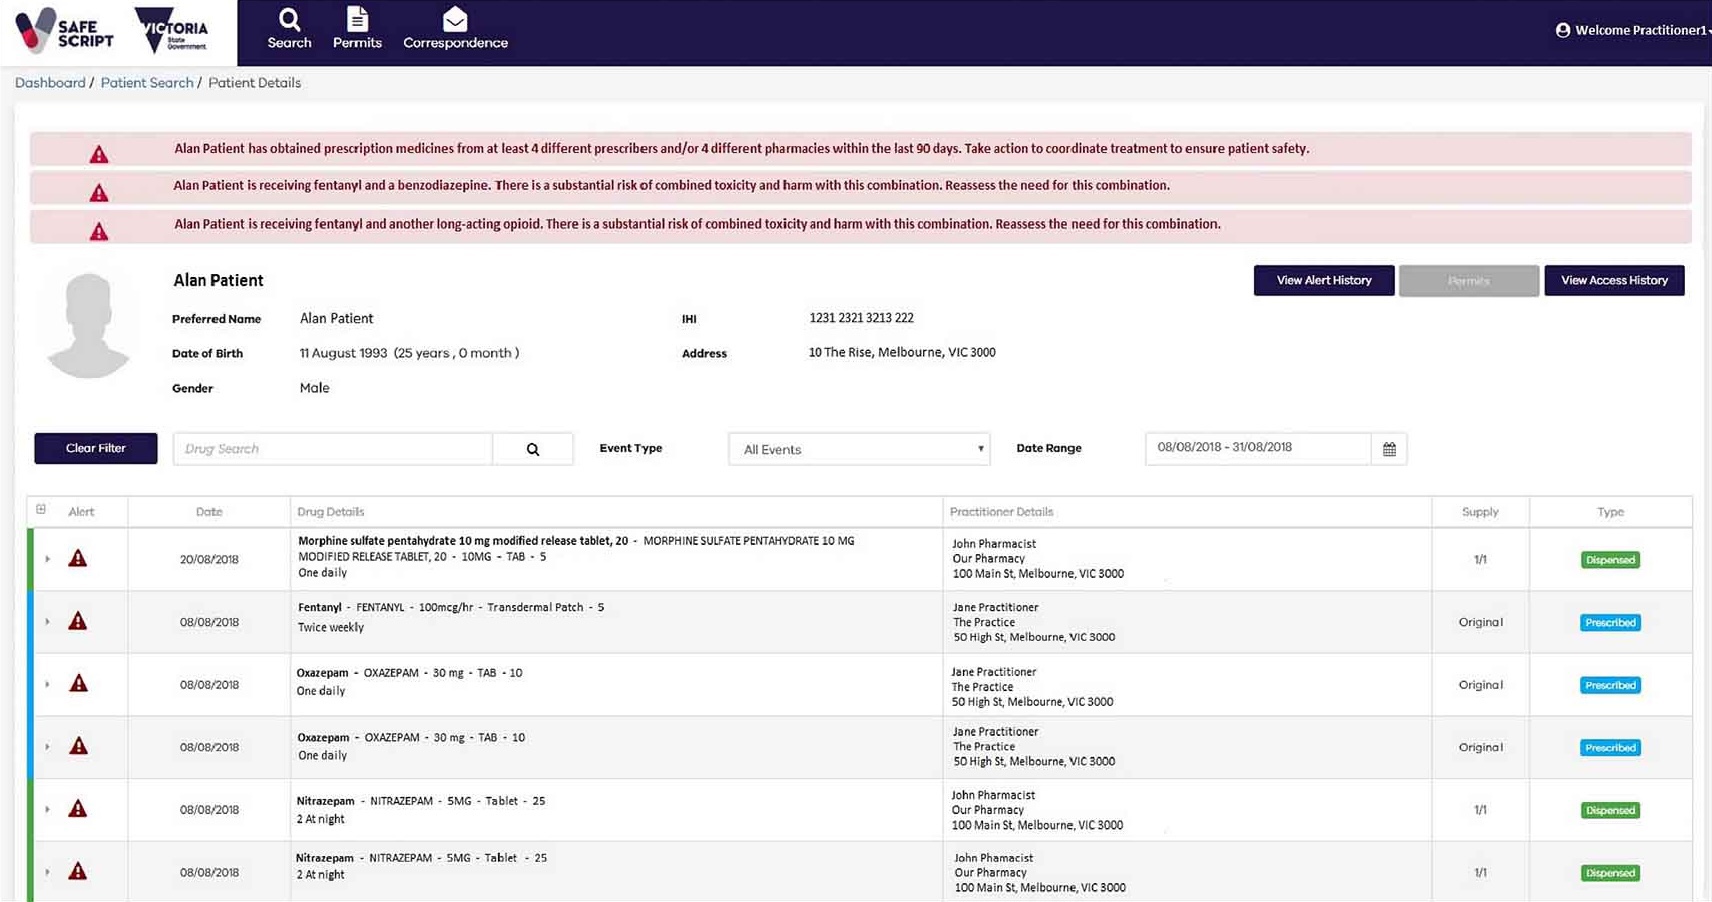
The pharmacist could see the previous dispense, but not the whole context.
In April 2026, I interviewed Pharmacy Operations and engineers to investigate why Interval Time UTDs persisted. Two problems emerged.
An allocation rule broken by Click & Collect
Approximately 90% of partner pharmacies accepted IPIP orders, while 10% did not. Existing allocation logic accounted for this distinction. The Click & Collect launch introduced a gap allowing IPIP orders to reach pharmacies that did not accept them. An interface change alone could not resolve this source of preventable UTDs.
Missing context during dispensing
Pharmacists checked Real Time Prescription Monitoring (RTPM) as part of dispensing. They could see that the same medication had recently been dispensed, but not clearly establish that the new order represented the remaining quantity from the same repeat.
Rather than investigate the patient’s uMeds order history themselves, pharmacists referred these orders to Pharmacy Operations. The team then reconstructed the prescription and dispensing timeline and sent supporting evidence back to the pharmacy.

From a patient-facing intervention to a pharmacist-facing solution.
Interval Time UTDs Monthly cases
July 2024 · Not tracked
Illustrative monthly counts; July and December 2025 are recorded. Tracking began September 2024. October 2026 is a partial month. View data & assumptions ↓
July 2024
Observe
A pharmacy visit exposed dispensing failures.
A pharmacy visit exposed dispensing failures and the manual resolution workflow. UTD tracking began in September 2024: July and August are untracked, not zero.
September 2024 – mid-2025
Advocate
A recurring operational issue.
Interval Time UTDs remained a recurring operational issue. The recorded rate generally ranged from 0.6–0.85%, with roughly 550–750 UTDs per month. June 2025 rose to 1.06%.
July 2025
First intervention
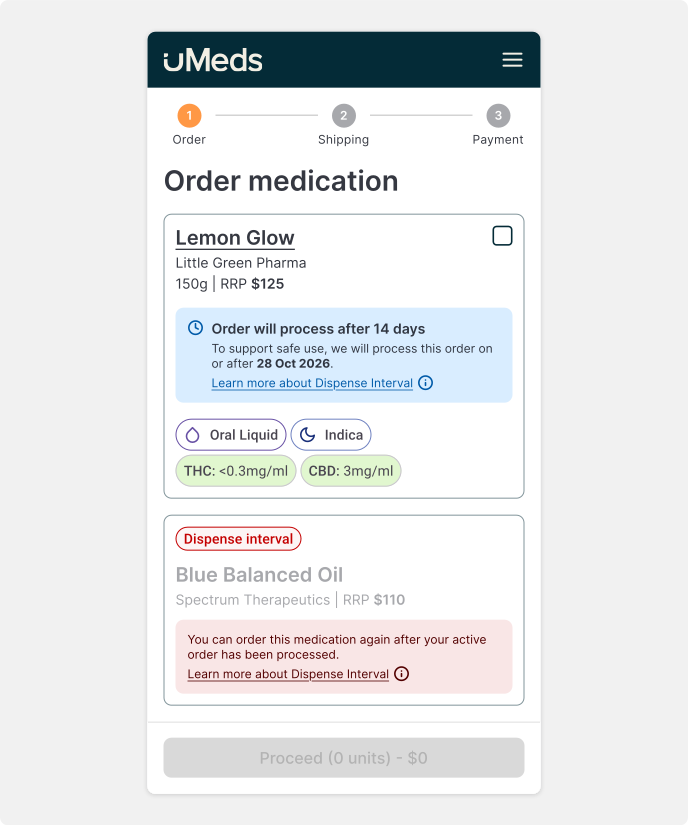
Make interval time visible to patients.
Another designer led a patient-facing project to mark medications in interval time while browsing. Patients could order ahead, with further purchases blocked until that order was dispensed. I provided problem context. July recorded 726 UTDs across 92,200 orders (0.79%).
December 2025
The peak
The earlier intervention was not enough.
Interval Time UTDs reached their highest recorded level: 1,122 at 1.42%.
January – March 2026
Recovery
Monthly rates recovered.
Monthly rates recovered to 0.78–0.82%.
April 2026
Investigate
Investigating a renewed increase.
Following Click & Collect’s launch, UTDs increased again to 1.10%. Investigation uncovered the IPIP allocation bug and missing pharmacist context. The allocation flag bug was present from 30 March to 18 May.
May – June 2026
Fix & design
Fixing allocation and designing the visualiser.
I worked with Delivery and Engineering to prioritise the allocation fix, and designed and tested the interval time visualiser. Allocation and look-back logic changed before launch. Rates fell to 0.71% in May and 0.57% in June.
13 July 2026
Visualiser launch
Launching the visualiser.
The visualiser launched with one pilot pharmacy for one week before network-wide rollout. I organised rollout and pharmacist training with Pharmacy Operations. UTDs fell from 86 the preceding week to 60 in launch week; the rate fell from 0.47% to 0.32%.
August – October 2026
Sustained improvement
Sustained improvement.
Monthly rates were 0.29% in August, 0.25% in September, and 0.21% in October to date. October is a partial month, not comparable with complete monthly counts.
Monthly cases: data & assumptions
Estimated counts are illustrative, not measured observations. Only July and December 2025 are recorded monthly counts. July and August 2024 were not tracked, not zero. October 2026 is incomplete and cannot be compared with full months. No causal effect should be inferred from this series.
| Month | Cases | Basis |
|---|---|---|
| July 2024 | — | Not tracked |
| August 2024 | — | Not tracked |
| September 2024 | 610 | Estimated |
| October 2024 | 650 | Estimated |
| November 2024 | 590 | Estimated |
| December 2024 | 630 | Estimated |
| January 2025 | 580 | Estimated |
| February 2025 | 620 | Estimated |
| March 2025 | 650 | Estimated |
| April 2025 | 690 | Estimated |
| May 2025 | 720 | Estimated |
| June 2025 | 880 | Estimated |
| July 2025 | 726 | Recorded |
| August 2025 | 800 | Estimated |
| September 2025 | 880 | Estimated |
| October 2025 | 960 | Estimated |
| November 2025 | 1040 | Estimated |
| December 2025 | 1122 | Recorded |
| January 2026 | 650 | Estimated |
| February 2026 | 620 | Estimated |
| March 2026 | 660 | Estimated |
| April 2026 | 880 | Estimated |
| May 2026 | 570 | Estimated |
| June 2026 | 450 | Estimated |
| July 2026 | 290 | Estimated |
| August 2026 | 230 | Estimated |
| September 2026 | 200 | Estimated |
| October 2026 | 42 | Estimated · partial month |
Why RTPM did not show the full picture
A day-15 order could begin a new repeat, even if a unit from the previous repeat was dispensed on day 12. Likewise, a day-19 IPIP order could supply the remaining unit of the repeat that began on day 15.
A recent dispense alone did not establish an interval violation. The pharmacist needed the repeat’s full history and quantity context.
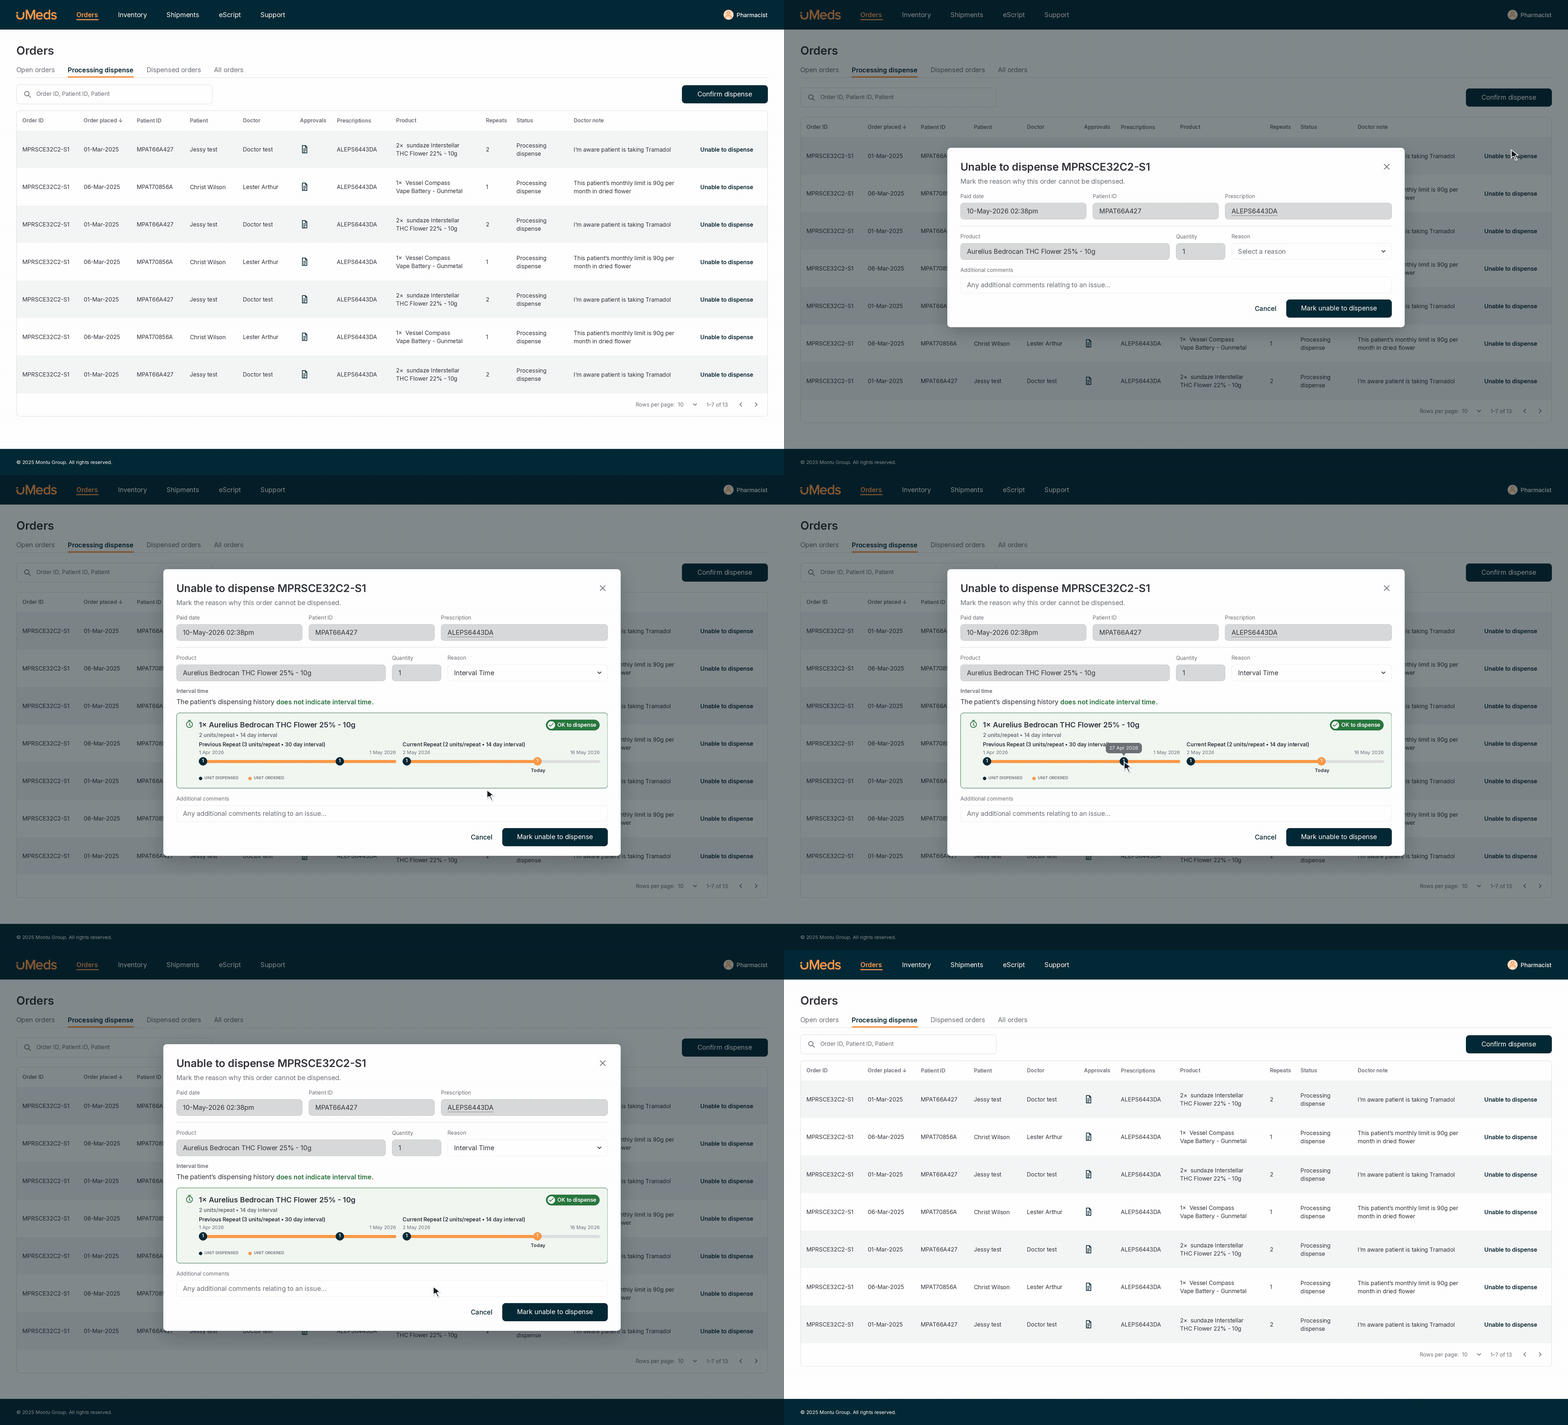
Fix the routing, then support the dispensing decision.
Restore IPIP-aware allocation
I worked with Delivery and Engineering to prioritise the Click & Collect allocation fix, preventing IPIP orders from reaching pharmacies that did not accept them. This addressed a system-level problem before asking pharmacists to change their behaviour.
Make interval time context visible
I designed and tested an interval time visualiser for pharmacists, then handed it over to Delivery and Engineering. It brought the relevant dispensing timeline into the pharmacist’s workflow, helping them assess whether an order represented a partial supply within an existing repeat.
The aim was to reduce the need for Pharmacy Operations to reconstruct and explain the same information manually.
“Easy to understand, the dispensed dates are accurate when cross-checked with RTPM.”
— Pharmacist feedback
A sustained reduction after launch.
Comparing the 6 weeks before launch (1 June–12 July) with the 13 weeks after launch (13 July–11 October):
| Measure | Before | After | Reduction |
|---|---|---|---|
| Average Interval Time UTDs per week | 97 | 52 | 47% |
| Recorded UTD rate | 0.54% | 0.28% | 48% |
| Share of Interval Time among all UTDs | 25% | 9% | 64% |
That is approximately 45 fewer Interval Time UTDs per week. Order volume remained broadly stable at 18,000–19,000 per week, indicating the reduction was not simply caused by fewer orders. The lowest recorded week, beginning 28 September, had 32 UTDs at 0.17%.
The mix of UTD reasons also shifted
| Approximate category share | Pre-July 2026 | Post-July 2026 |
|---|---|---|
| Dispense limit | 45% | 61% |
| Interval time | 25% | 9% |
| Script issue | 10% | 10% |
| Conflicting medication | 10% | 10% |
| No reason provided | 10% | 10% |
| Other | <1% | <1% |
Interval time’s reported share fell by 16 percentage points. These are approximate category shares, not order-level rates. Dispense Limit’s increased share alone does not establish an increase in absolute volume.
Measurement limitations
This is a before-and-after comparison, not a controlled experiment. The allocation fix and look-back changes had already reduced UTDs before the visualiser launched. The timing and sustained improvement support the visualiser’s contribution, but do not isolate its effect from other changes.
Reducing the problem did not require eliminating every exception.
Some Interval Time UTDs remained because consecutive orders could be placed before the previous order was dispensed, before the next interval could be calculated. Pharmacists sometimes selected Interval Time when another reason applied. Pharmacies also differed on calculation when interval time changed between scripts.
By September the recorded rate was approximately 0.25%. With the issue more manageable, I prioritised the larger Dispense Limit UTD problem rather than pursuing increasingly marginal reductions.
The right intervention was not another checkout warning.
The first intervention helped patients understand when their order would be held. It did not resolve the context pharmacists needed to assess partial quantity orders.